NBS4Drought
Showcase 01

City wetland park for surface water co-creation in Barcelona, Spain

A 3 ha linear SUDS wetland park harvesting rainwater across three city-centre streets for park maintenance, aquifer recharge, and drought-season reuse.

SpainMediterraneanUrban

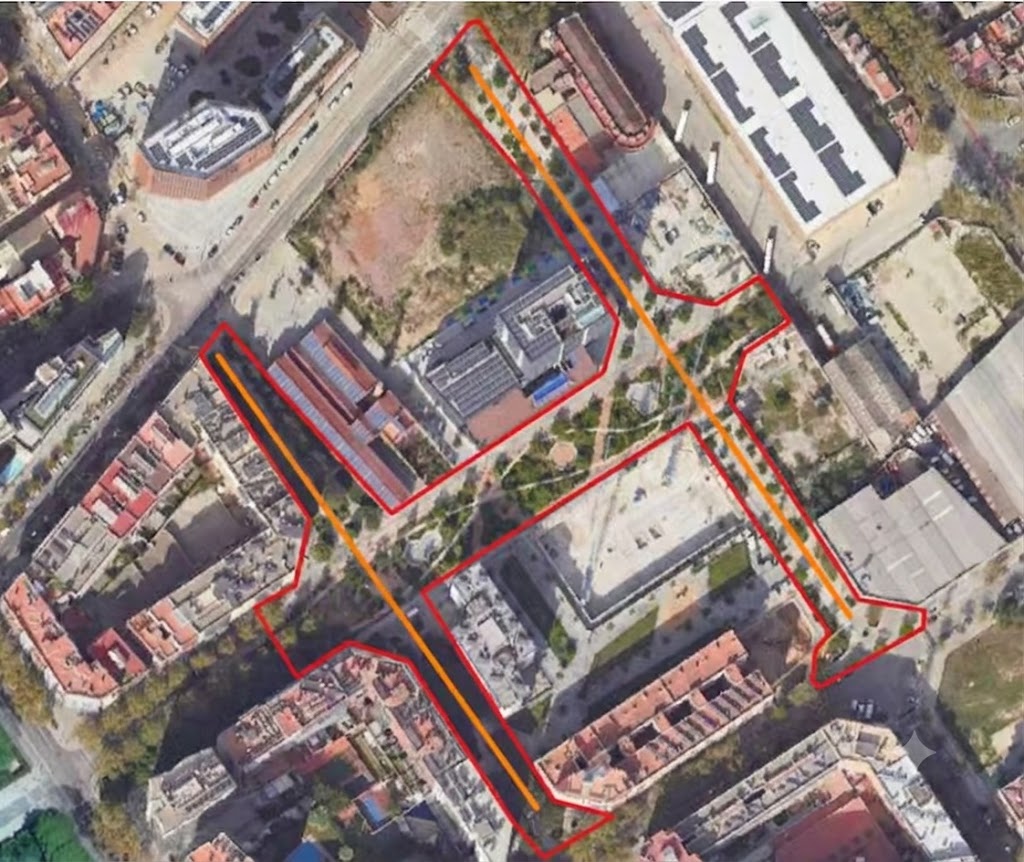
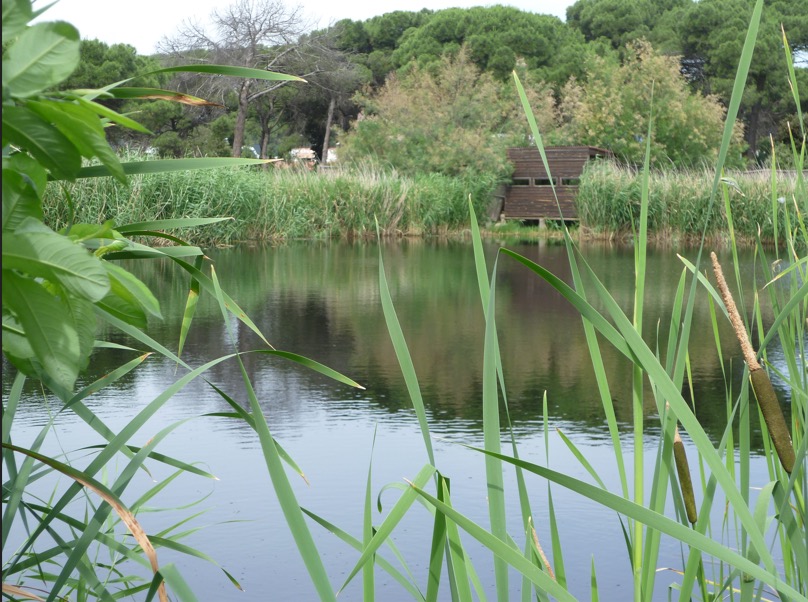
The Green axis Cristobal de la Moura features a sustainable urban drainage system that harvests rainwater from the city catchment and channels it into a 30,000 m² linear wetland park across three streets in Barcelona city centre. Collected water supports park maintenance, groundwater aquifer recharge, and local uses such as plant irrigation and street cleaning during drought seasons, reducing reliance on tap water. The showcase tests how an urban wetland park as a nature-based solution can enhance urban water management, foster water recreation during drought periods, and deliver biodiversity and wellbeing benefits by transforming grey infrastructure into green public space.

Socio-economic monitoring shows how people access, use, perceive, and engage with this showcase. It combines partner-uploaded social indicators with geo-based survey results where available.

Accessibility

Awaiting 2025 data

Visitors

Awaiting 2025 data

Sentiment

Awaiting survey data

Survey responses

Survey not started

Well-being

Survey not started

Engagement

Awaiting 2025 data

Latest indicator overview

Awaiting 2025 data

JanFebMarAprMayJunJulAugSepOctNov
S1A Time accessibilityS1B Wetland visitorsS2A Sentiment Index

Geo-based survey summary

Per assessment point: anonymous aggregated mean scores for sentiment (S2A), physical well-being (S2B), and mental well-being (S2C). Individual responses are never shown.

SC1 — Green axis Cristobal de la Moura — geo-based survey map
Planned points
4
Responses
Coverage
0%

Assessment points — Sentiment

  • Playgroundn=0 ·
  • Resting arean=0 ·
  • Carrer de Fluvian=0 ·
  • Carrer de Provençalsn=0 ·
Survey active
Showcase boundaryAssessment points
PositiveNeutralNegative

Configured indicators (Socio-economic)

CodeIndicatorWhat it measuresSourceFrequencyStatus
S1ATime accessibilityPopulation or travel-time access to the wetlandPartner upload / External Data AnalysisAnnualAwaiting 2025 data
S1BWetland visitorsNumber of visitors per yearPartner uploadAnnualAwaiting 2025 data
S1CUsers accessibilityPotential users per km²Partner upload / External Data AnalysisAnnualAwaiting 2025 data
S2ASentiment IndexPositive, neutral, and negative perceptionPartner upload / geo-based surveyAnnual / survey-basedAwaiting survey data
S2BPhysical well-being surveySelf-reported physical well-beingGeo-based surveySurvey-basedSurvey not started
S2CMental well-being surveySelf-reported mental well-beingGeo-based surveySurvey-basedSurvey not started
S3APublic involvementParticipation in wetland-related activitiesPartner uploadAnnualAwaiting 2025 data
S3BVirtual engagementOnline or digital engagement levelPartner uploadAnnualAwaiting 2025 data
S3CSocial contribution to scienceNumber or percentage of public contributionsPartner uploadAnnualAwaiting 2025 data

Related forum discussions

  • Interpreting water quality trends for this showcase
  • Biodiversity monitoring data gaps
Open Forum

Gallery

Field images and visual material

Images help communicate site context, monitoring activities, and nature-based solution interventions.

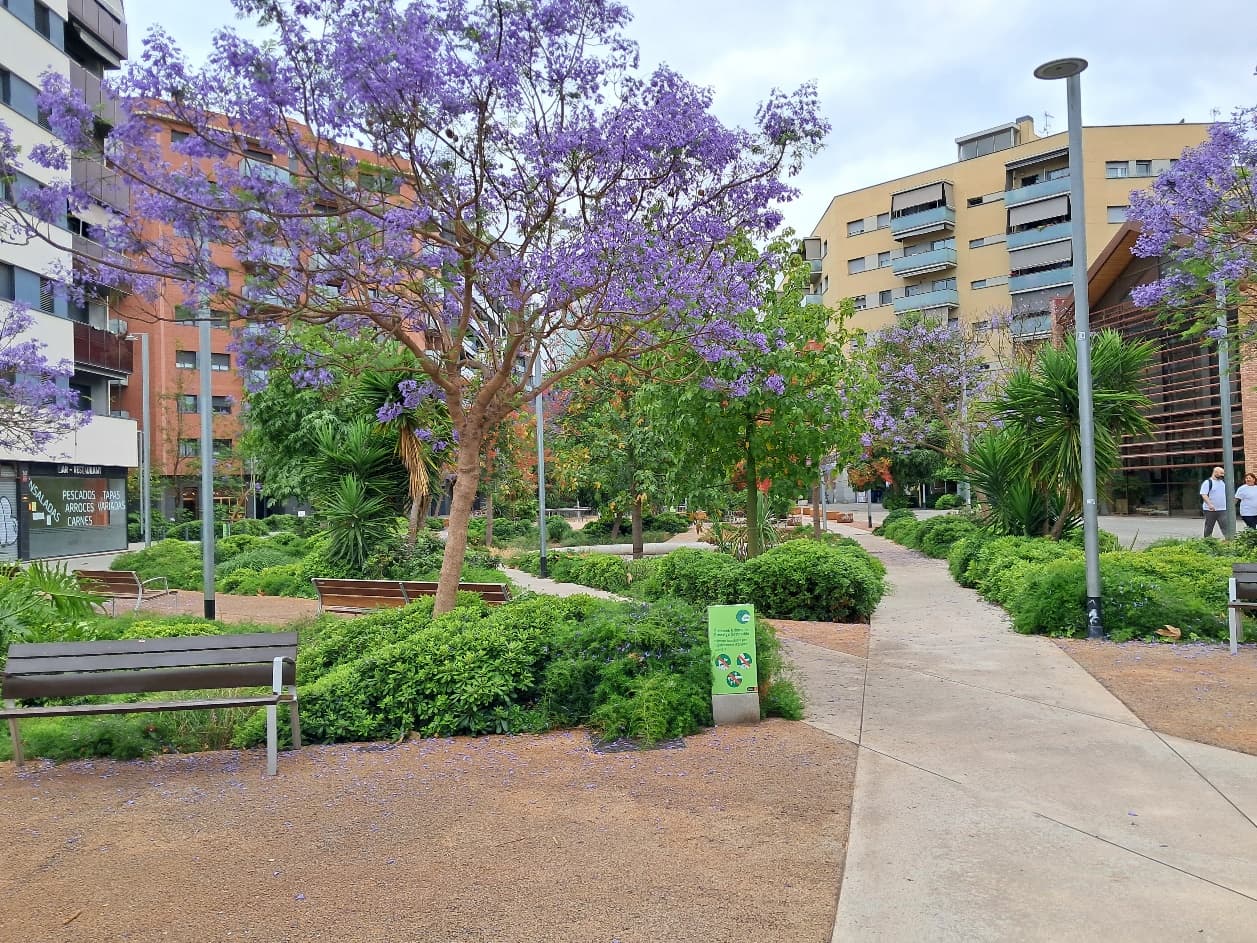
Linear wetland park along the green axis

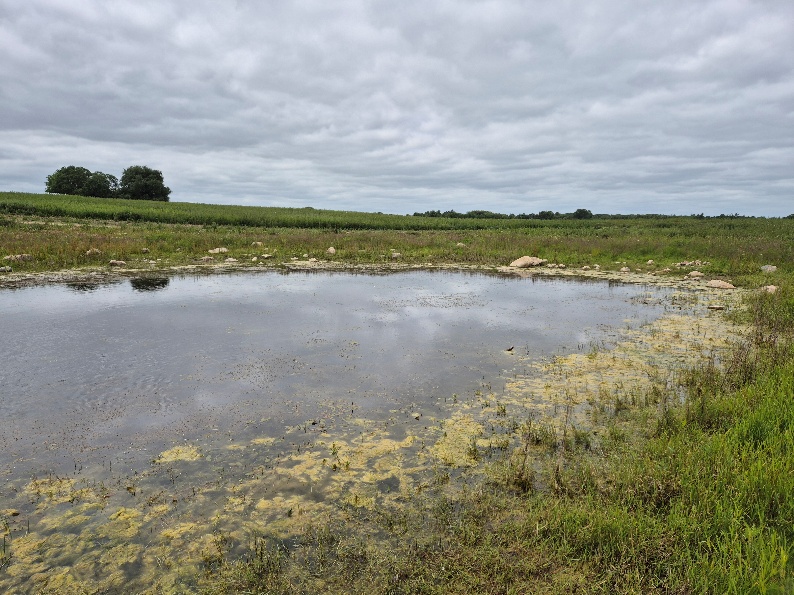
Rainwater harvesting and retention features

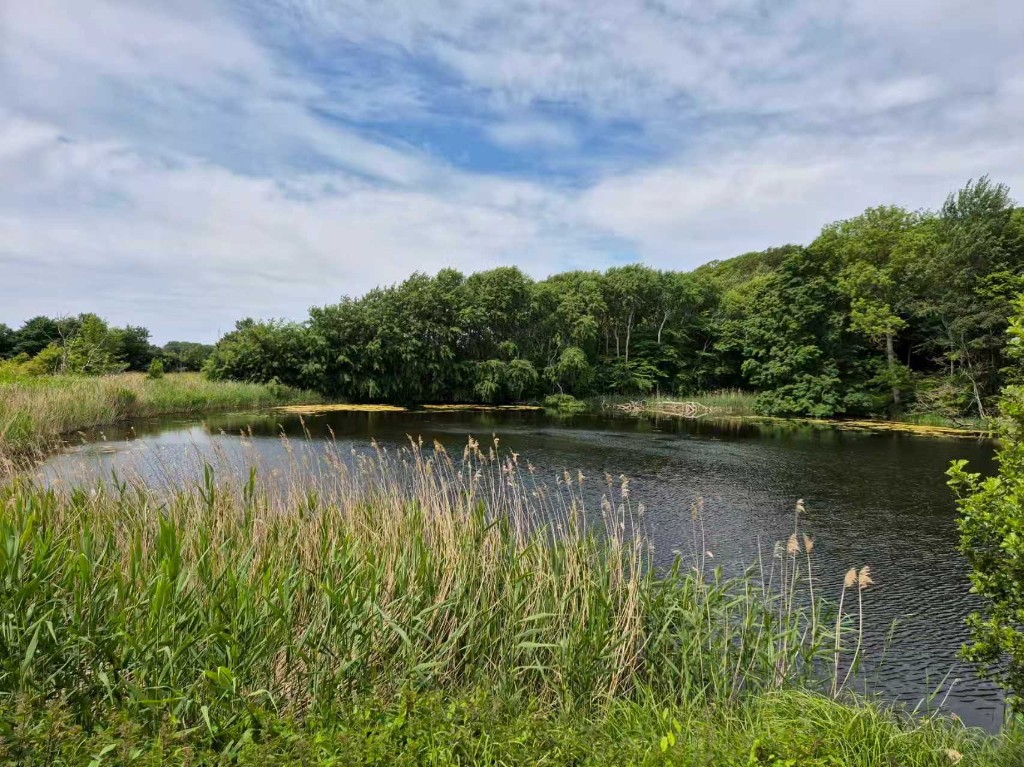
Urban green corridor in Barcelona

Public green space along Cristobal de la Moura